
Novel approach can sort cells up to 38 times faster
 A group of researchers led by computer scientists at the Jacobs School of Engineering at University of California San Diego (UC San Diego) has developed a new method that optimizes the sorting of cells up to 38 times faster compared to other currently available methods. It utilizes computer vision and hardware optimization and could be used for clinical diagnostics, stem cell characterization and other applications.
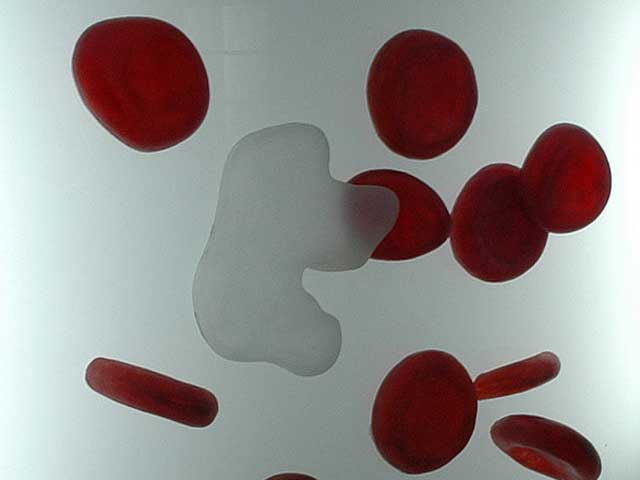
Novel method improves on a biophysical technique known as imaging flow cytometry. Flow cytometry is employed in cell counting, cell sorting, biomarker detection and protein engineering. It utilizes a camera set on a microscope to capture the morphological features of hundreds to thousands of cells per second while the cells are suspended in a solution moving at approximately 4 meters (13.12 feet) per second.
On account of the cells shape and structure, imaging flow cytometry sorts the cells into different categories. If these characteristics can be calculated swiftly enough, the cells can be sorted in real-time. The camera used for imaging flow cytometry operates at 140,000 frames per second. Currently used algorithms analyze a single frame for 10 to 0.4 seconds, making the technique impractical.

“Previous techniques simply could not keep up with the image data streaming off of this high speed camera”, said Ryan Kastner, a professor of computer science at UC San Diego.
They developed a custom hardware solution using a field-gate programmable array (FPGA) which considerably speeds up the process to 11.94 milliseconds. The second approach achieved slower results of around 151.7 milliseconds, but these results were obtained using a graphics processing unit (GPU).
Researchers plan to analyze the cell properties in real-time, and use that information to sort the cells. To do that, the sorting decision must be made in less than 10 milliseconds.
The ultimate goal is to determine the radius at every angle of each cell and to perform this determination at about 7 microseconds per frame. In order to do so, the algorithm must first detect: the presence of the cell, the center of the cell, determine distance from cell center to cell wall at every angle and determine cell radius based on these figures. The algorithm was carefully modified to run faster on the FPGA.

The Blob Search module detects the cell area in the input image and converts the black and white image of the cell into a binary image, where each pixel carries either a zero or non-zero value. The result image has only cell area pixels highlighted. Using the binary image, the system detects the presence of a cell and its location. It creates a histogram, a graphical representation of the distribution of data in the image, from the image on both axes.
The system then crops a 20 by 20 pixel image around the cell. To improve the accuracy of the analysis, the selected cell area from the Blob Search module is resized by a factor of 10 and a higher-contrast image of the cell is generated.
The Find Center module finds the center of the cell by converting the higher contrast images to binary images. It counts the pixels with a non-zero value in each row and column — then averages the data from two images produced by the Interpolation module to find the cell’s center point. Finally, the algorithm determines morphological properties of the cell using the interpolated image and its corresponding center point.
The UC San Diego research team analyzed each step in the algorithm, and made modifications to the algorithm when necessary to implement it efficiently on the FPGA. They optimized the process by carefully considering the complexity of an algorithm versus the accuracy of their result. Although algorithms with larger numbers of decisions points or those requiring multiple data passes, FPGAs can be configured to exactly match an algorithm, thus allowing quick operation of such algorithms.
FPGA system takes under 500 microseconds to detect a cell and calculate its radius. To see it in action, click the image bellow to run the animated image.

According to Kastner, the new technology has a potential to lead to a number of clinical breakthroughs, and his team is working closely with University of California Los Angeles and their industrial partners to commercialize their technology.
For more information, you can read the paper: “A hardware accelerated approach for imaging flow cytometry” [2.2MB PDF].
Leave your response!